
Dashboards (v51)


Our version 51 introduces our new concept of building custom flexible real-time dashboards.
The concept was introduced to solve two problems.
- All customers use our product in different ways and on different levels in the organization.
- It’s hard to share data without going back to older technologies like paper.
Solving issue number one
We have many different people in all kinds of positions using our platform, this ranges from operators, technicians, and SCADA programmers to lean managers, foremen, and executives.
All have the same goal but with different approaches and problems to solve. Operators need to operate their machines as efficiently as possible, technicians need to have the machine running as much as possible without defects. Foremen and executives want to minimize bottlenecks and increase the throughput and drive better digitalization throughout the factory.
Creating a dashboard

First of all, you can create as many dashboards as you’d like, unlimited.
To create one, you simply to go “Dashboard” from the home navigation after you’ve logged in. After that, you press the button “Add” in the top right corner. After you’ve chosen a name for your dashboard you’re redirected to a blank canvas like the one you see above.
At first, you’ll not see any modules/widgets, to create one you simply press the button “Add Widget” in the top right corner. After that, add the widgets you want for the machines you want to see data for, and arrange them however you like, you can drag and drop them around and make them bigger or smaller.
When you are happy with your layout, press the button “Save” and then press “View”.
You should now see something similar to this:
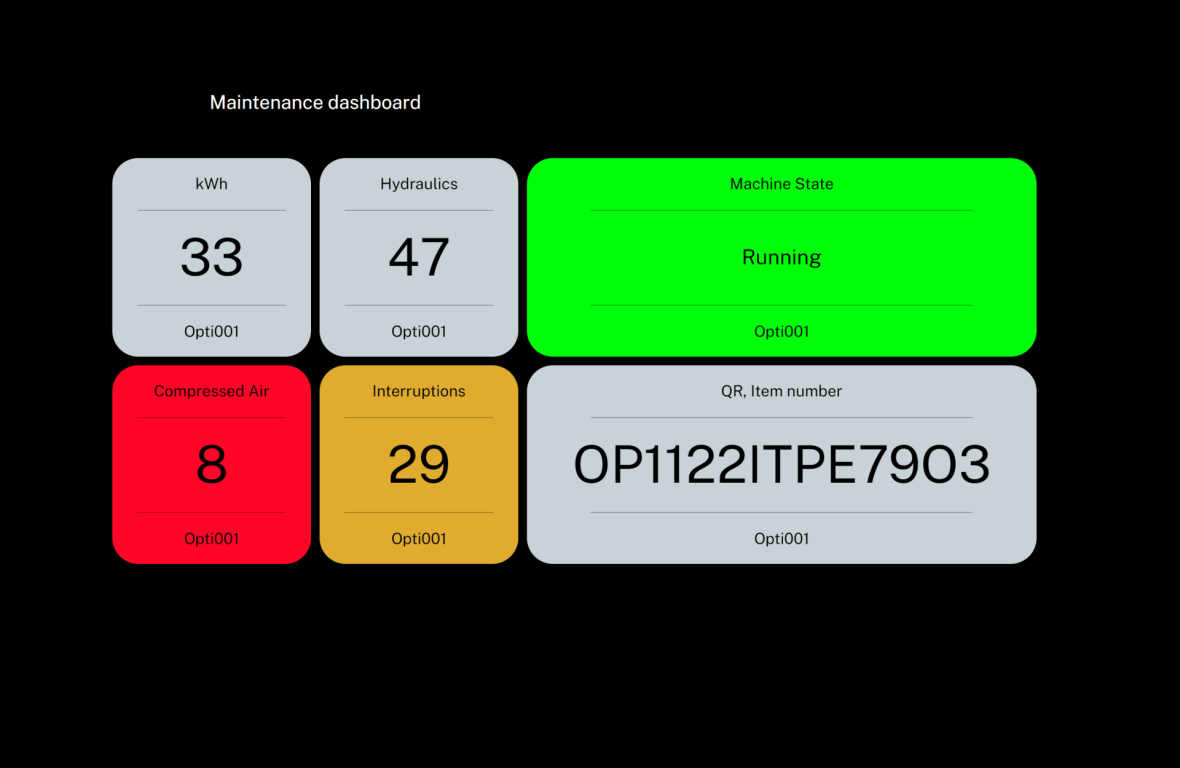
The above picture is a dashboard I’ve made for machine maintenance purposes. Here a technician can easily follow the critical numbers for Hydraulics, compressed air, and the current state of the machine.
The widgets will change color depending on what you’ve defined as critical, normal, and great.
You can also see what the machine is actively producing now.
Here I’ve created an efficiency dashboard for OEE KPIs.

With a system like this, you can very quickly create new dashboards serving different needs on all different levels in the organization.
The dashboard will also automatically adapt to any screen size and use your layout if possible. If the screen is too small for the chosen layout, for example on a mobile, we’ll adapt the widgets to fit a mobile so you’ll still be able to see the data easily.
Solving issue number two
We’ve seen the tendency that people using our platform, still print out reports and use paper to share data across the factory. One of the reasons for this is that it’ll be almost impossible for all individuals in the company to learn new software like this. Even with intuitive software like Opticloud, which is easy to learn compared to most MES systems or other systems alike, it’s still a piece of software that needs to be learned and understood.
So it’s more easy to just print out what data needs to be shared, whether that is for meetings, dailies, presentations, or other things.
With the dashboard, you can create and share the things you need, without your colleagues needing a login or a tutorial for Opticloud.
Simply copy and paste the dashboard link with the dashboard key to your colleague or include it in the meeting link, and your colleague now has access to the dashboard you’ve created. After you’re done you can simply delete it and all access to it is lost again.

You can try and log into my dashboard here, follow this link:
https://portal.optipeople.dk/realtime-dashboard/login
And use this key to login: 2OaPS8P
Book a demo
Enter your name, company and telephone number below, and we will call and arrange a meeting as soon as possible.
Book a demo
Enter your name and company mail, and we will arrange a demo as soon as possible.