
Insights
Units produced per hour (v51)
by OptiPeople Team
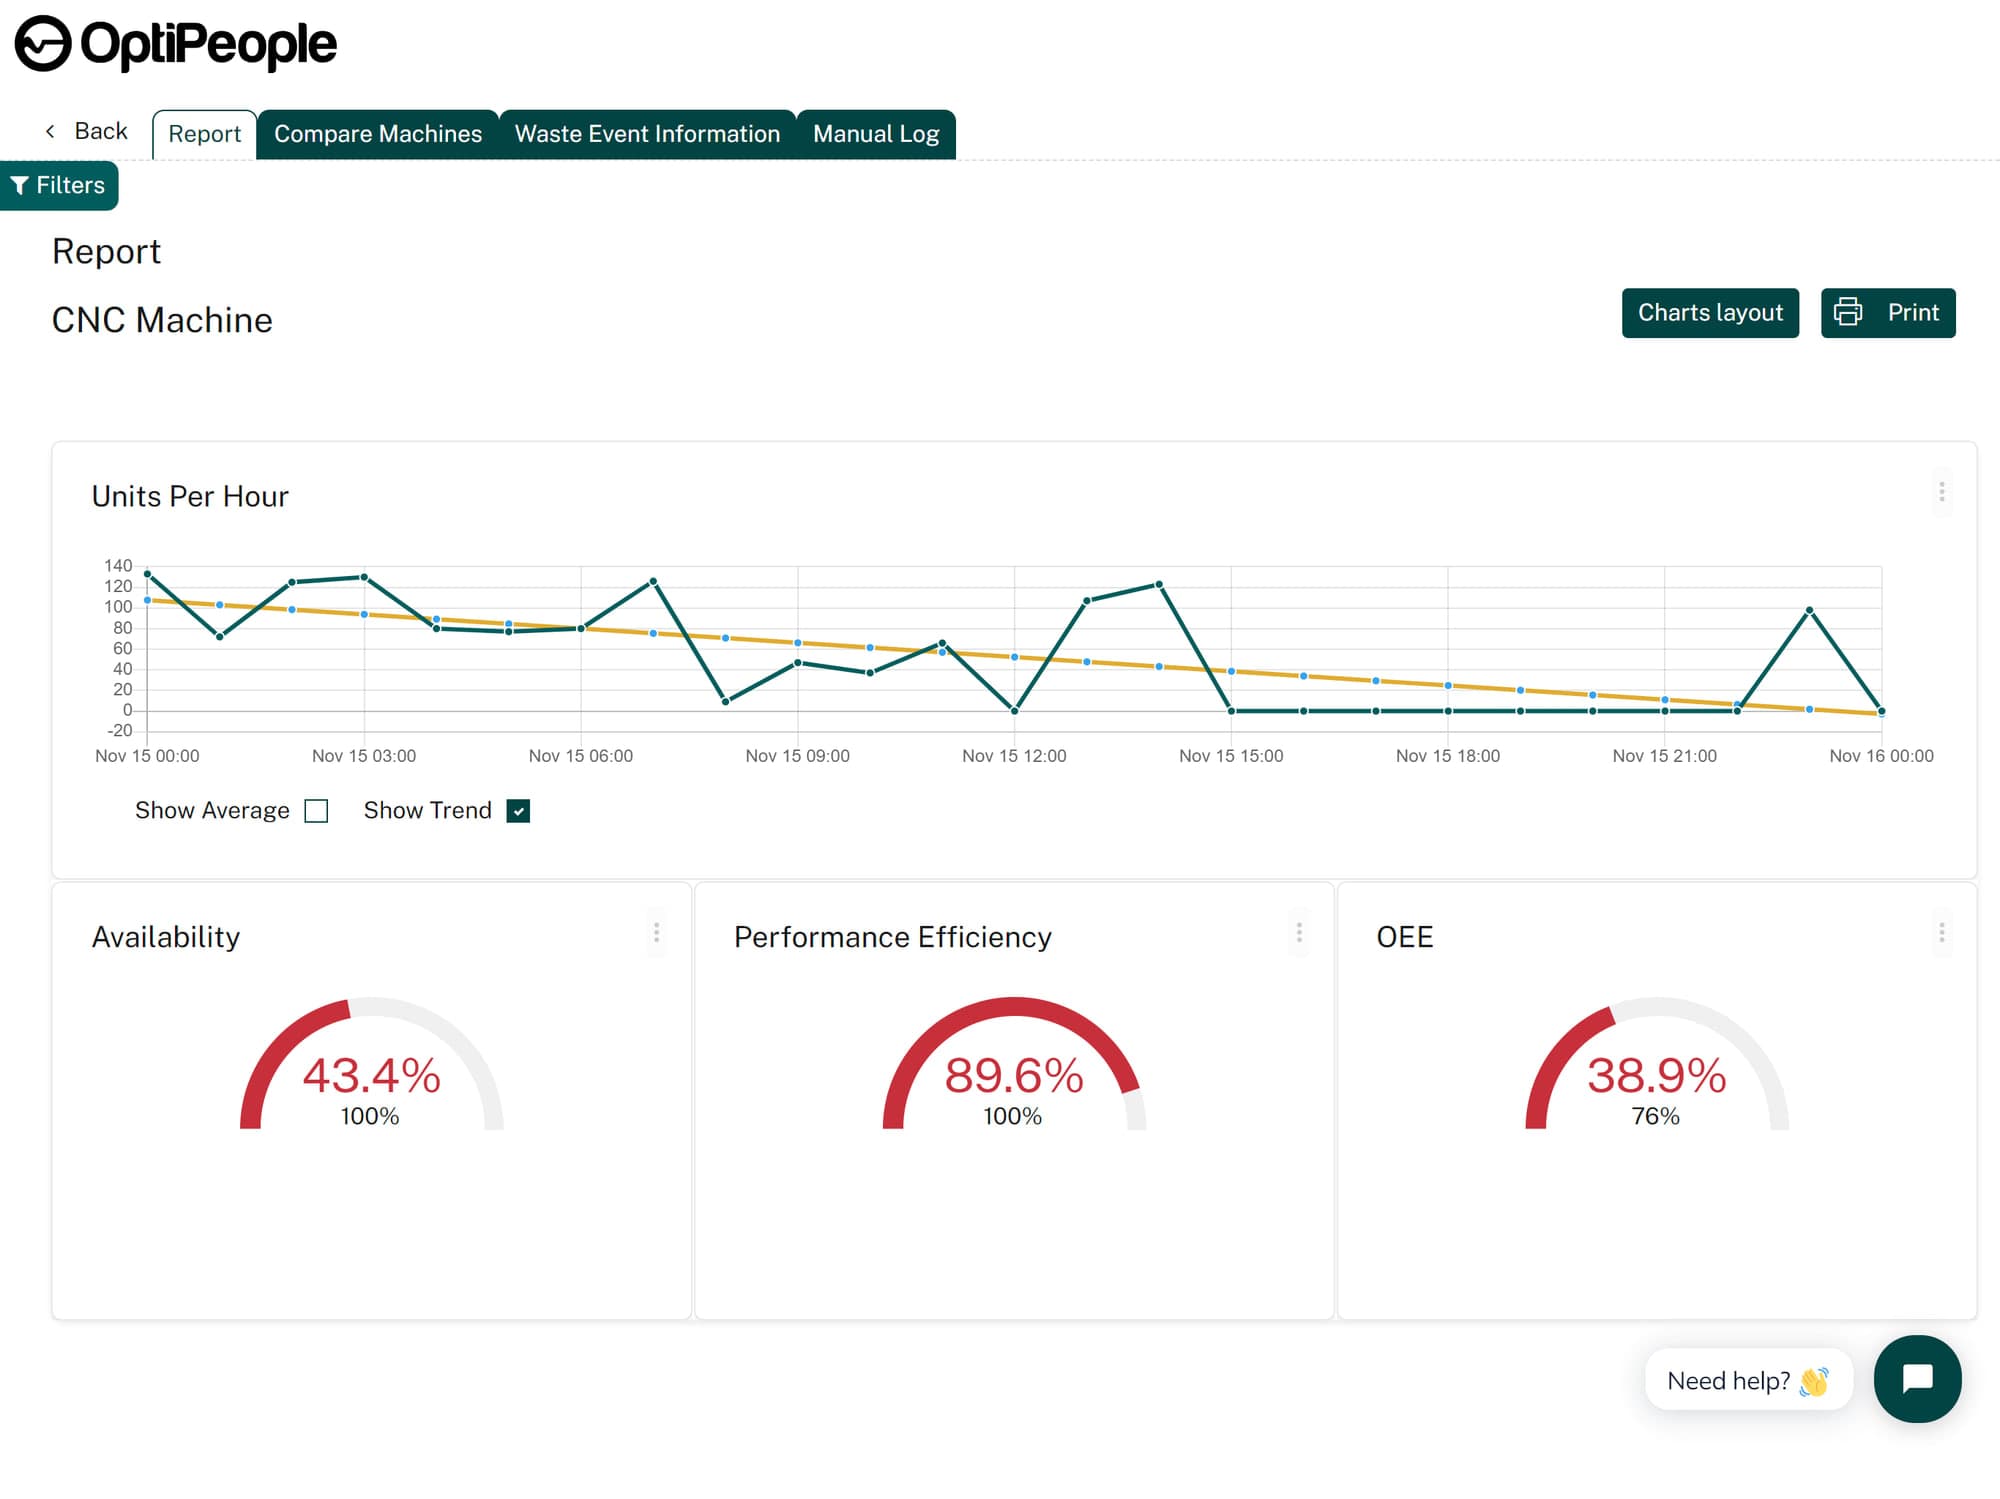
Version 51 of OptiPeople Data Platform introduced a new graph for units produced per hour.
This graph aggregates output over time and makes it easy to visualize production speed at the right level of detail.
How the graph works
The graph automatically adjusts based on the selected time range:
- for a single day, it shows individual hours
- for a week, it shows production by day
- for multiple months or years, it zooms out to show broader time periods
This means you can always see production speed clearly, whether you need detailed hourly visibility or a larger management overview.
Why it matters
The graph also includes:
- a trend line
- an average line
When you zoom out, those lines make it easier to see whether production is moving in the right direction over time.
This feature gives teams a simple way to track throughput development and spot changes in performance faster.