
OEE module
See where production time is lost
Track OEE in real time and understand exactly where production time disappears. Stop guessing, start improving.
Typical results
- 15-25%
- OEE improvement in first year
- 40%
- Reduction in unplanned downtime
- 2 hrs
- Saved daily on manual reporting
Your production data shouldn't live in spreadsheets
Most factories still rely on manual logs, whiteboards, and end-of-shift reports to understand what happened on the floor. By the time the data reaches a decision-maker, the moment to act has passed. The OEE module replaces guesswork with live signals from every machine, every shift.
Everything you need for production visibility
Live OEE dashboards
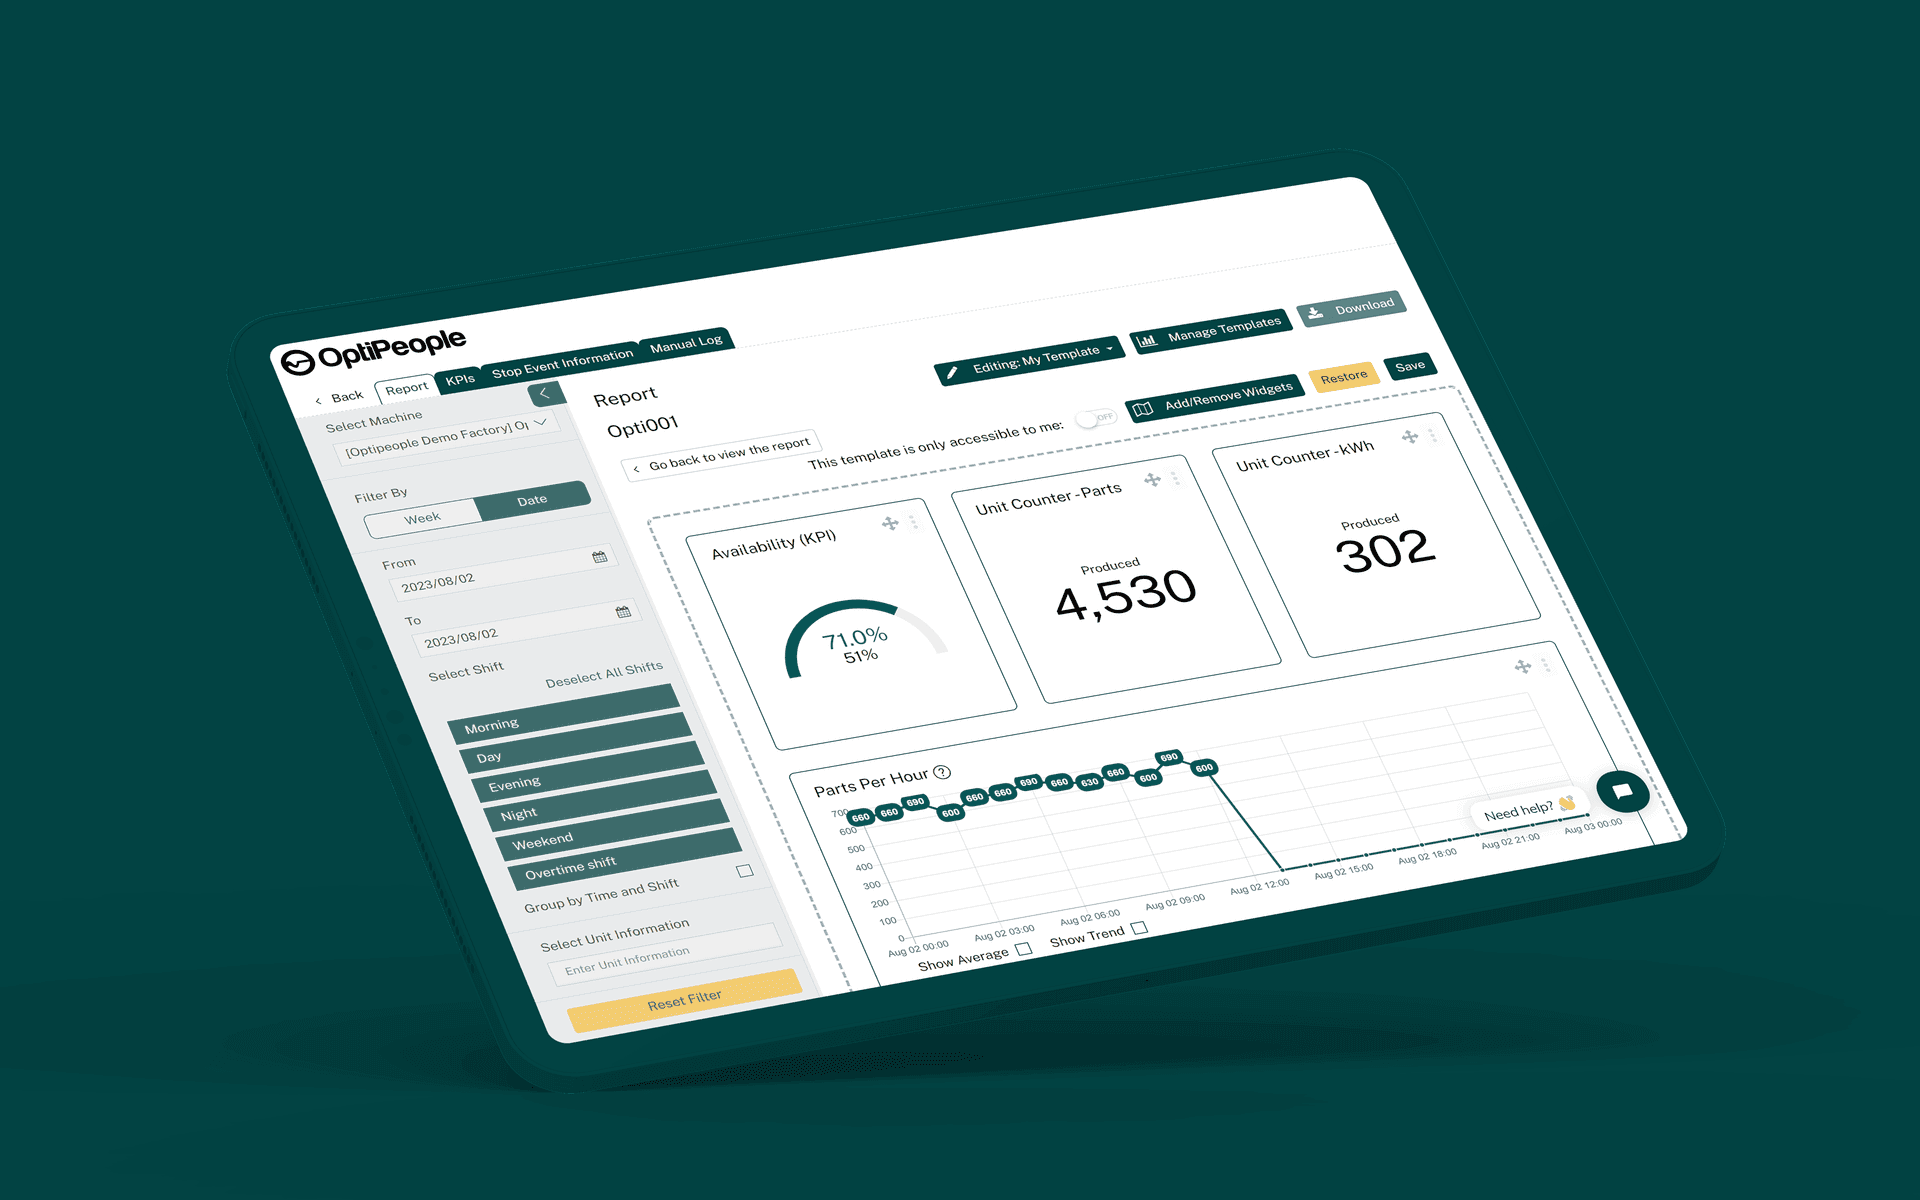
See availability, performance, and quality in real time across every machine or workstation, line, and shift. No more waiting for end-of-day reports.
Stop cause registration
Operators register downtime reasons directly at the machine or workstation. Clean, structured data you can actually use to drive improvements.
Shift performance
Compare performance across shifts, teams, and time periods. Identify best practices and replicate success across the organization.
Continuous improvement
Run targeted improvement cycles with data. Track the impact of every change and build a culture of measurable progress.
Performance and quality losses
Availability is the easy third. See the speed losses and the scrap that quietly take the rest, per machine or workstation, item, and setup.
Production reports
Automated daily, weekly, and monthly reports delivered to stakeholders with the KPIs that matter most.
Go deeper
Production efficiency
Track OEE live and understand performance across shifts, lines, and machines or workstations, based on real production data, not guesswork.
Stop cause registration
Operators register stops directly at the machine or workstation, while the context is fresh. You get clean, structured data you can actually act on.
Analysis and reporting
Turn production data into clear reports on performance, losses, and cost drivers, without spreadsheets or manual work.
How it works
- 01
Connect
We integrate with your existing machines and PLCs. No production disruption, no hardware overhaul.
- 02
Visualize
Your team gets a live dashboard from day one. Real-time OEE, stop causes, and shift performance all in one place.
- 03
Improve
Use the data to run targeted improvement cycles. Track the impact of every change you make.
Product view
The number, the shift, and what took the time
Availability, performance, and OEE against target, the shift on a timeline, and every stop that cost it, in one view.
Shift timeline
18 stops · 44 min lostAgainst target
Availability
86.3%
target 95%
Performance
62.4%
target 80%
OEE
53.9%
target 70%
Stop distribution
Stop log