OptiPeopleOptipeople

Production efficiency

See where production time is lost

Track OEE live and understand performance across shifts, lines, and machines or workstations, based on real production data, not guesswork.

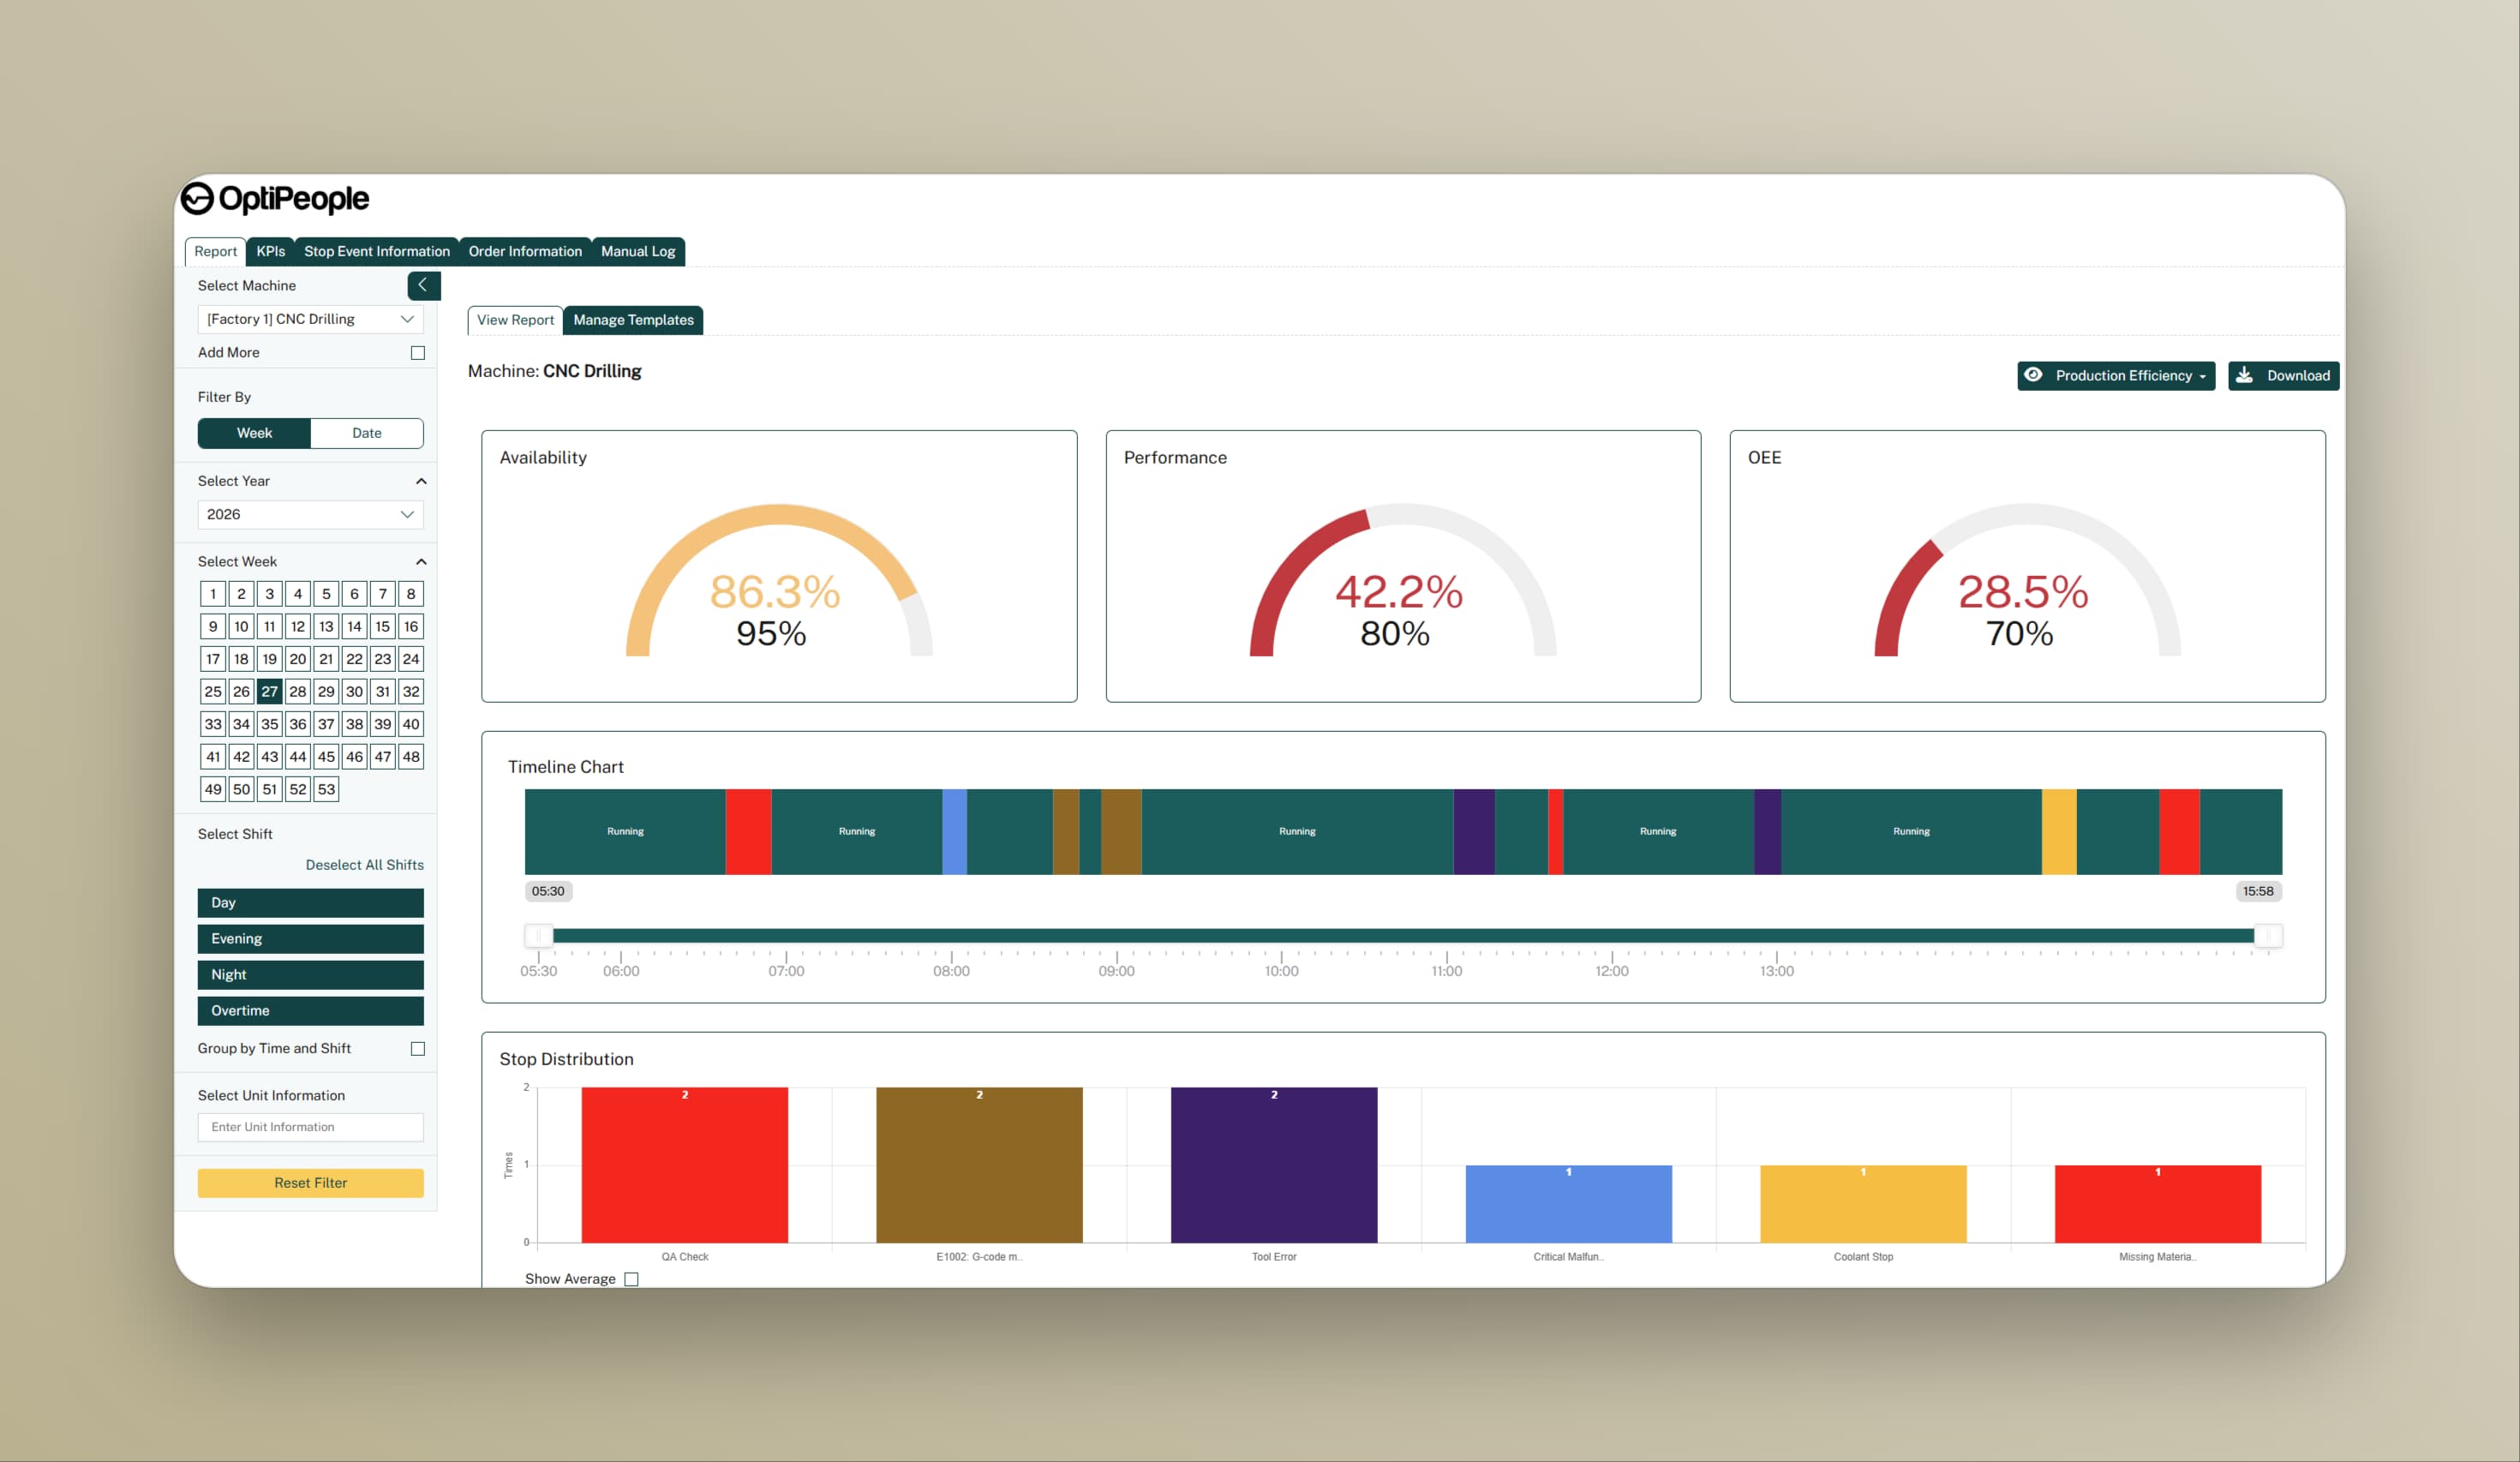
OptiPeople efficiency report with live availability, performance, and OEE gauges against target

Typical results

15-25%
OEE improvement in the first year
2 hrs
Saved daily on manual reporting
< 1 min
From machine event to dashboard

Your production data should work as hard as your team

Most factories still piece together performance from shift handover notes, spreadsheets, and end-of-day reports. By the time someone sees the numbers, the moment to act has passed. Production Efficiency gives you a live, accurate picture, so decisions happen while they still matter.

See capabilities

From raw signals to real understanding

Every machine tells a story. Production Efficiency translates it into numbers, timelines, and comparisons your team can act on.

01

Live OEE in one view

Availability, performance, and quality calculated automatically from machine and workstation data. Your OEE score updates as production runs, with drill-down by machine or workstation, line, or area. No spreadsheets. No waiting for the shift report.
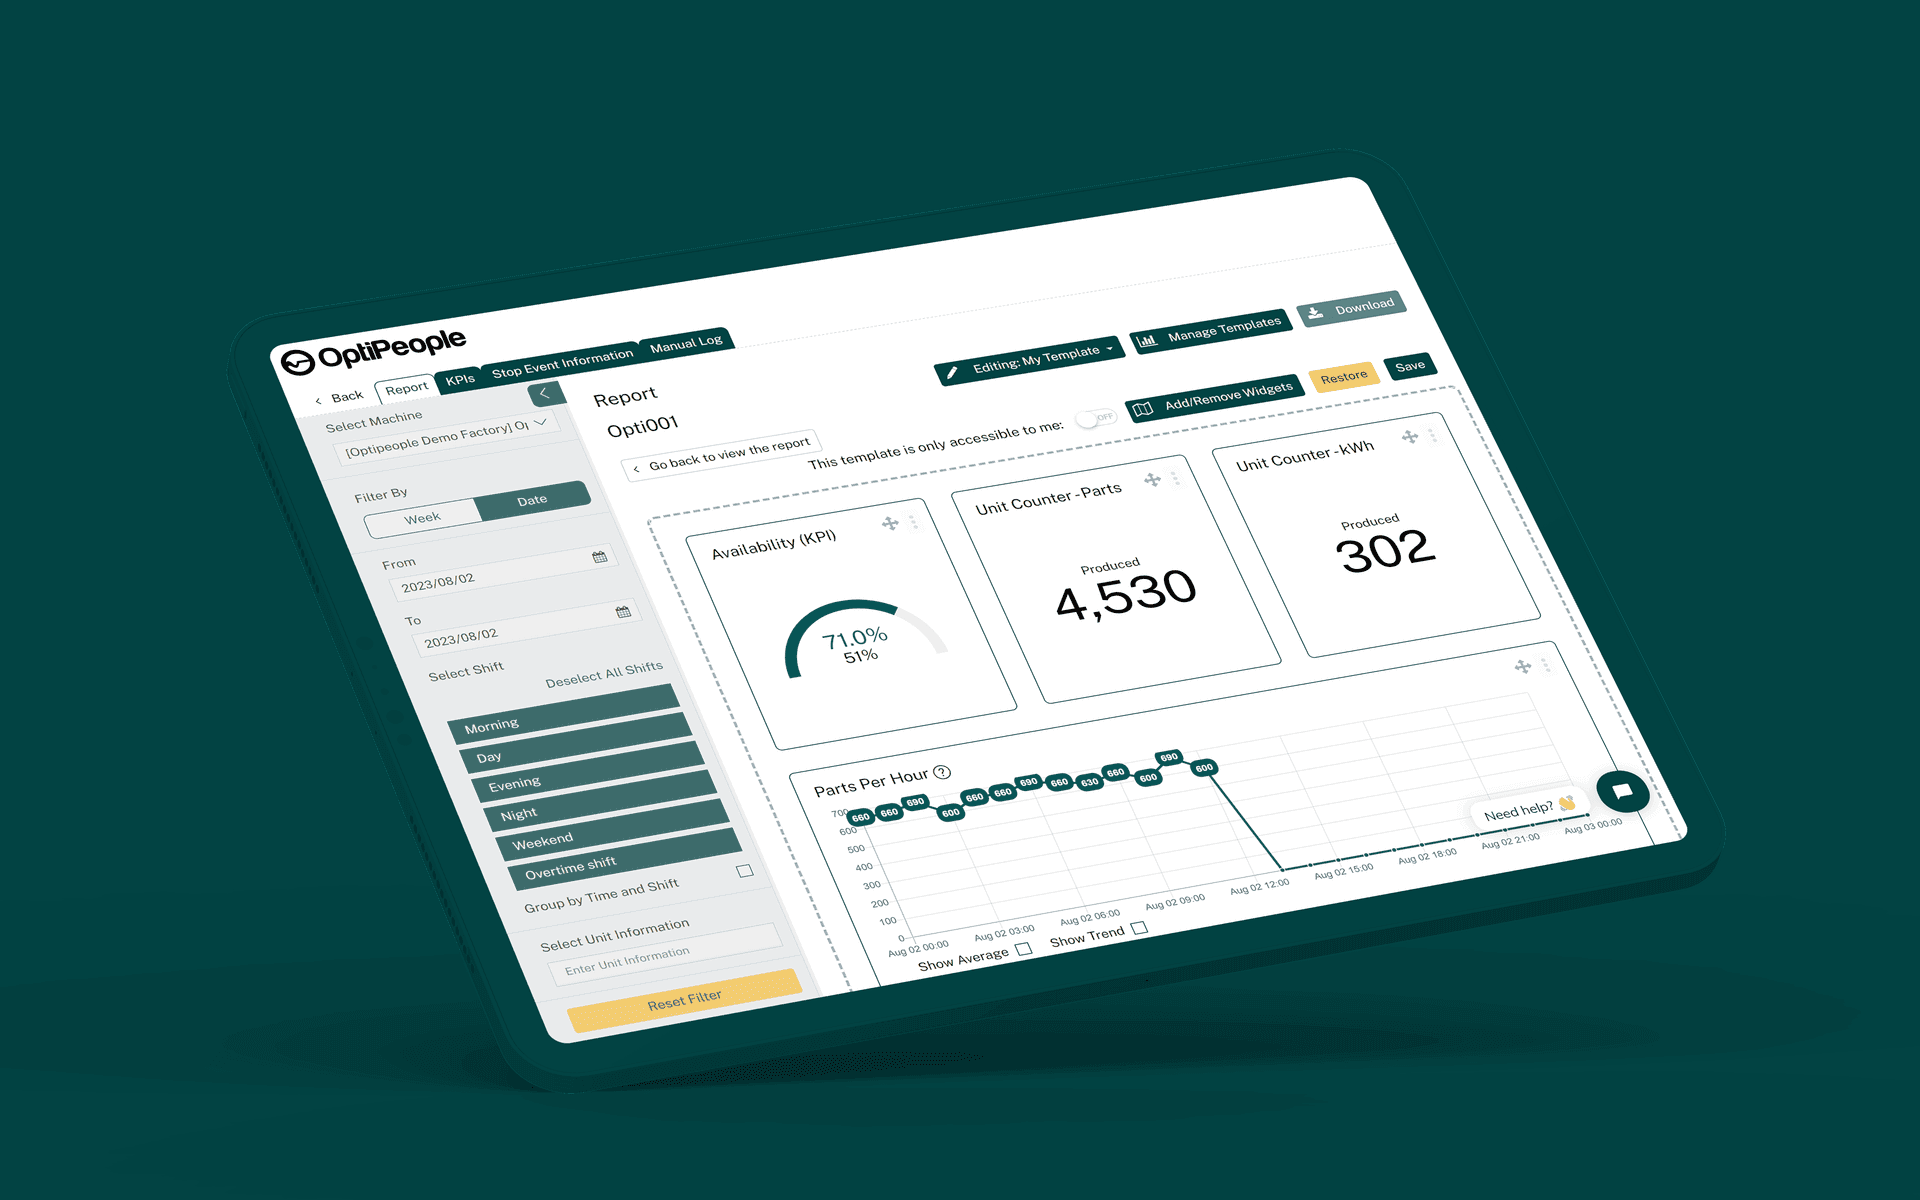
OptiPeople OEE dashboard showing availability gauge, unit counter, and parts per hour chart
02

See what happened, hour by hour

Color-coded timelines show running, stopped, setup, and idle states for every machine. Spot patterns that shift reports miss, like the 20 minutes lost to changeover every morning that nobody talks about.

Timeline chart showing running, stopped, setup, and idle states across a full shift
03

Compare shifts, lines, and machines

Side-by-side performance data across any dimension you care about. See which shifts consistently outperform, which lines underdeliver, and where the gap between best and worst is widest.

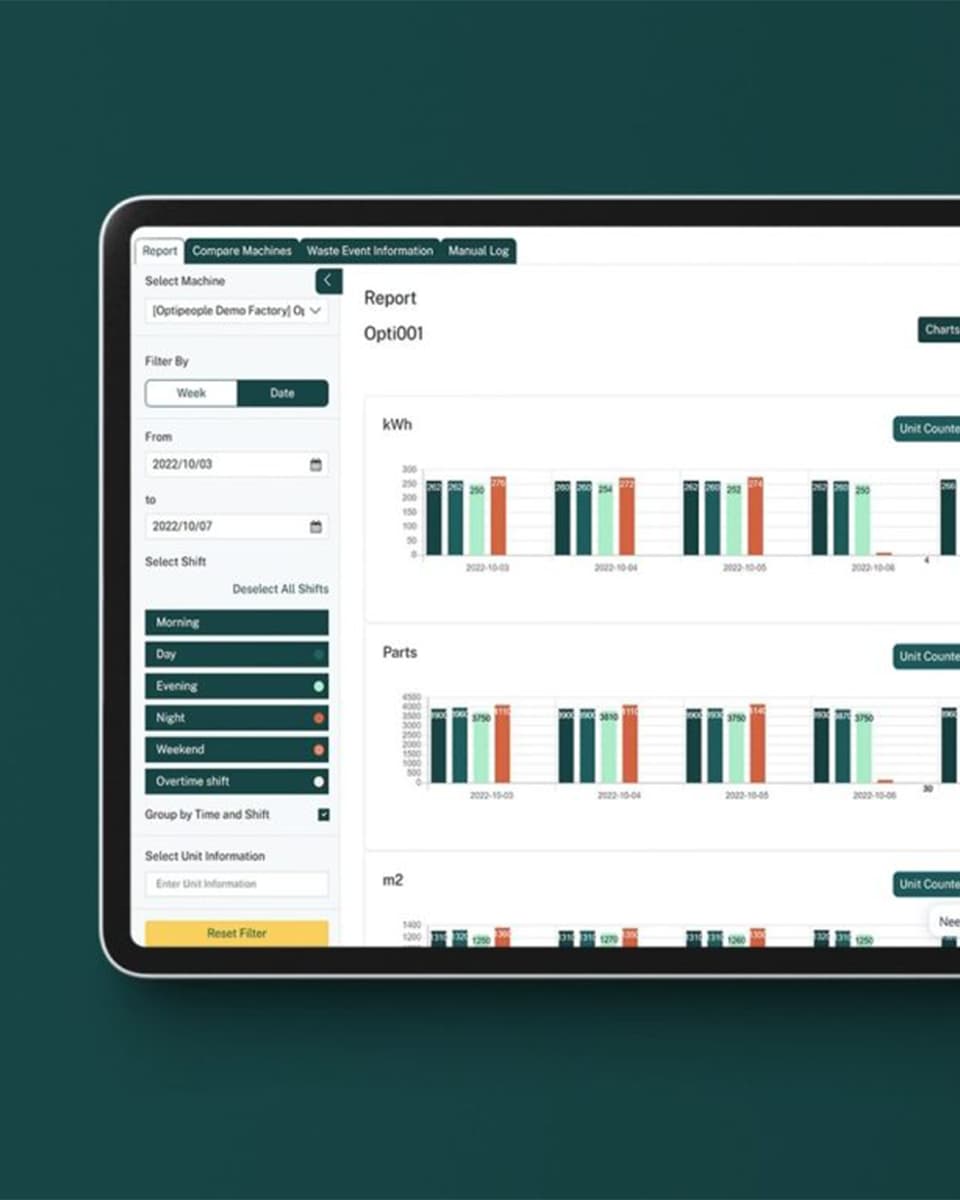
Bar chart report comparing production performance across shifts and lines

Product view

The full picture, from floor to management

Operators see their machine or workstation. Team leads see their line. Managers see the plant. Same data, right level of detail.

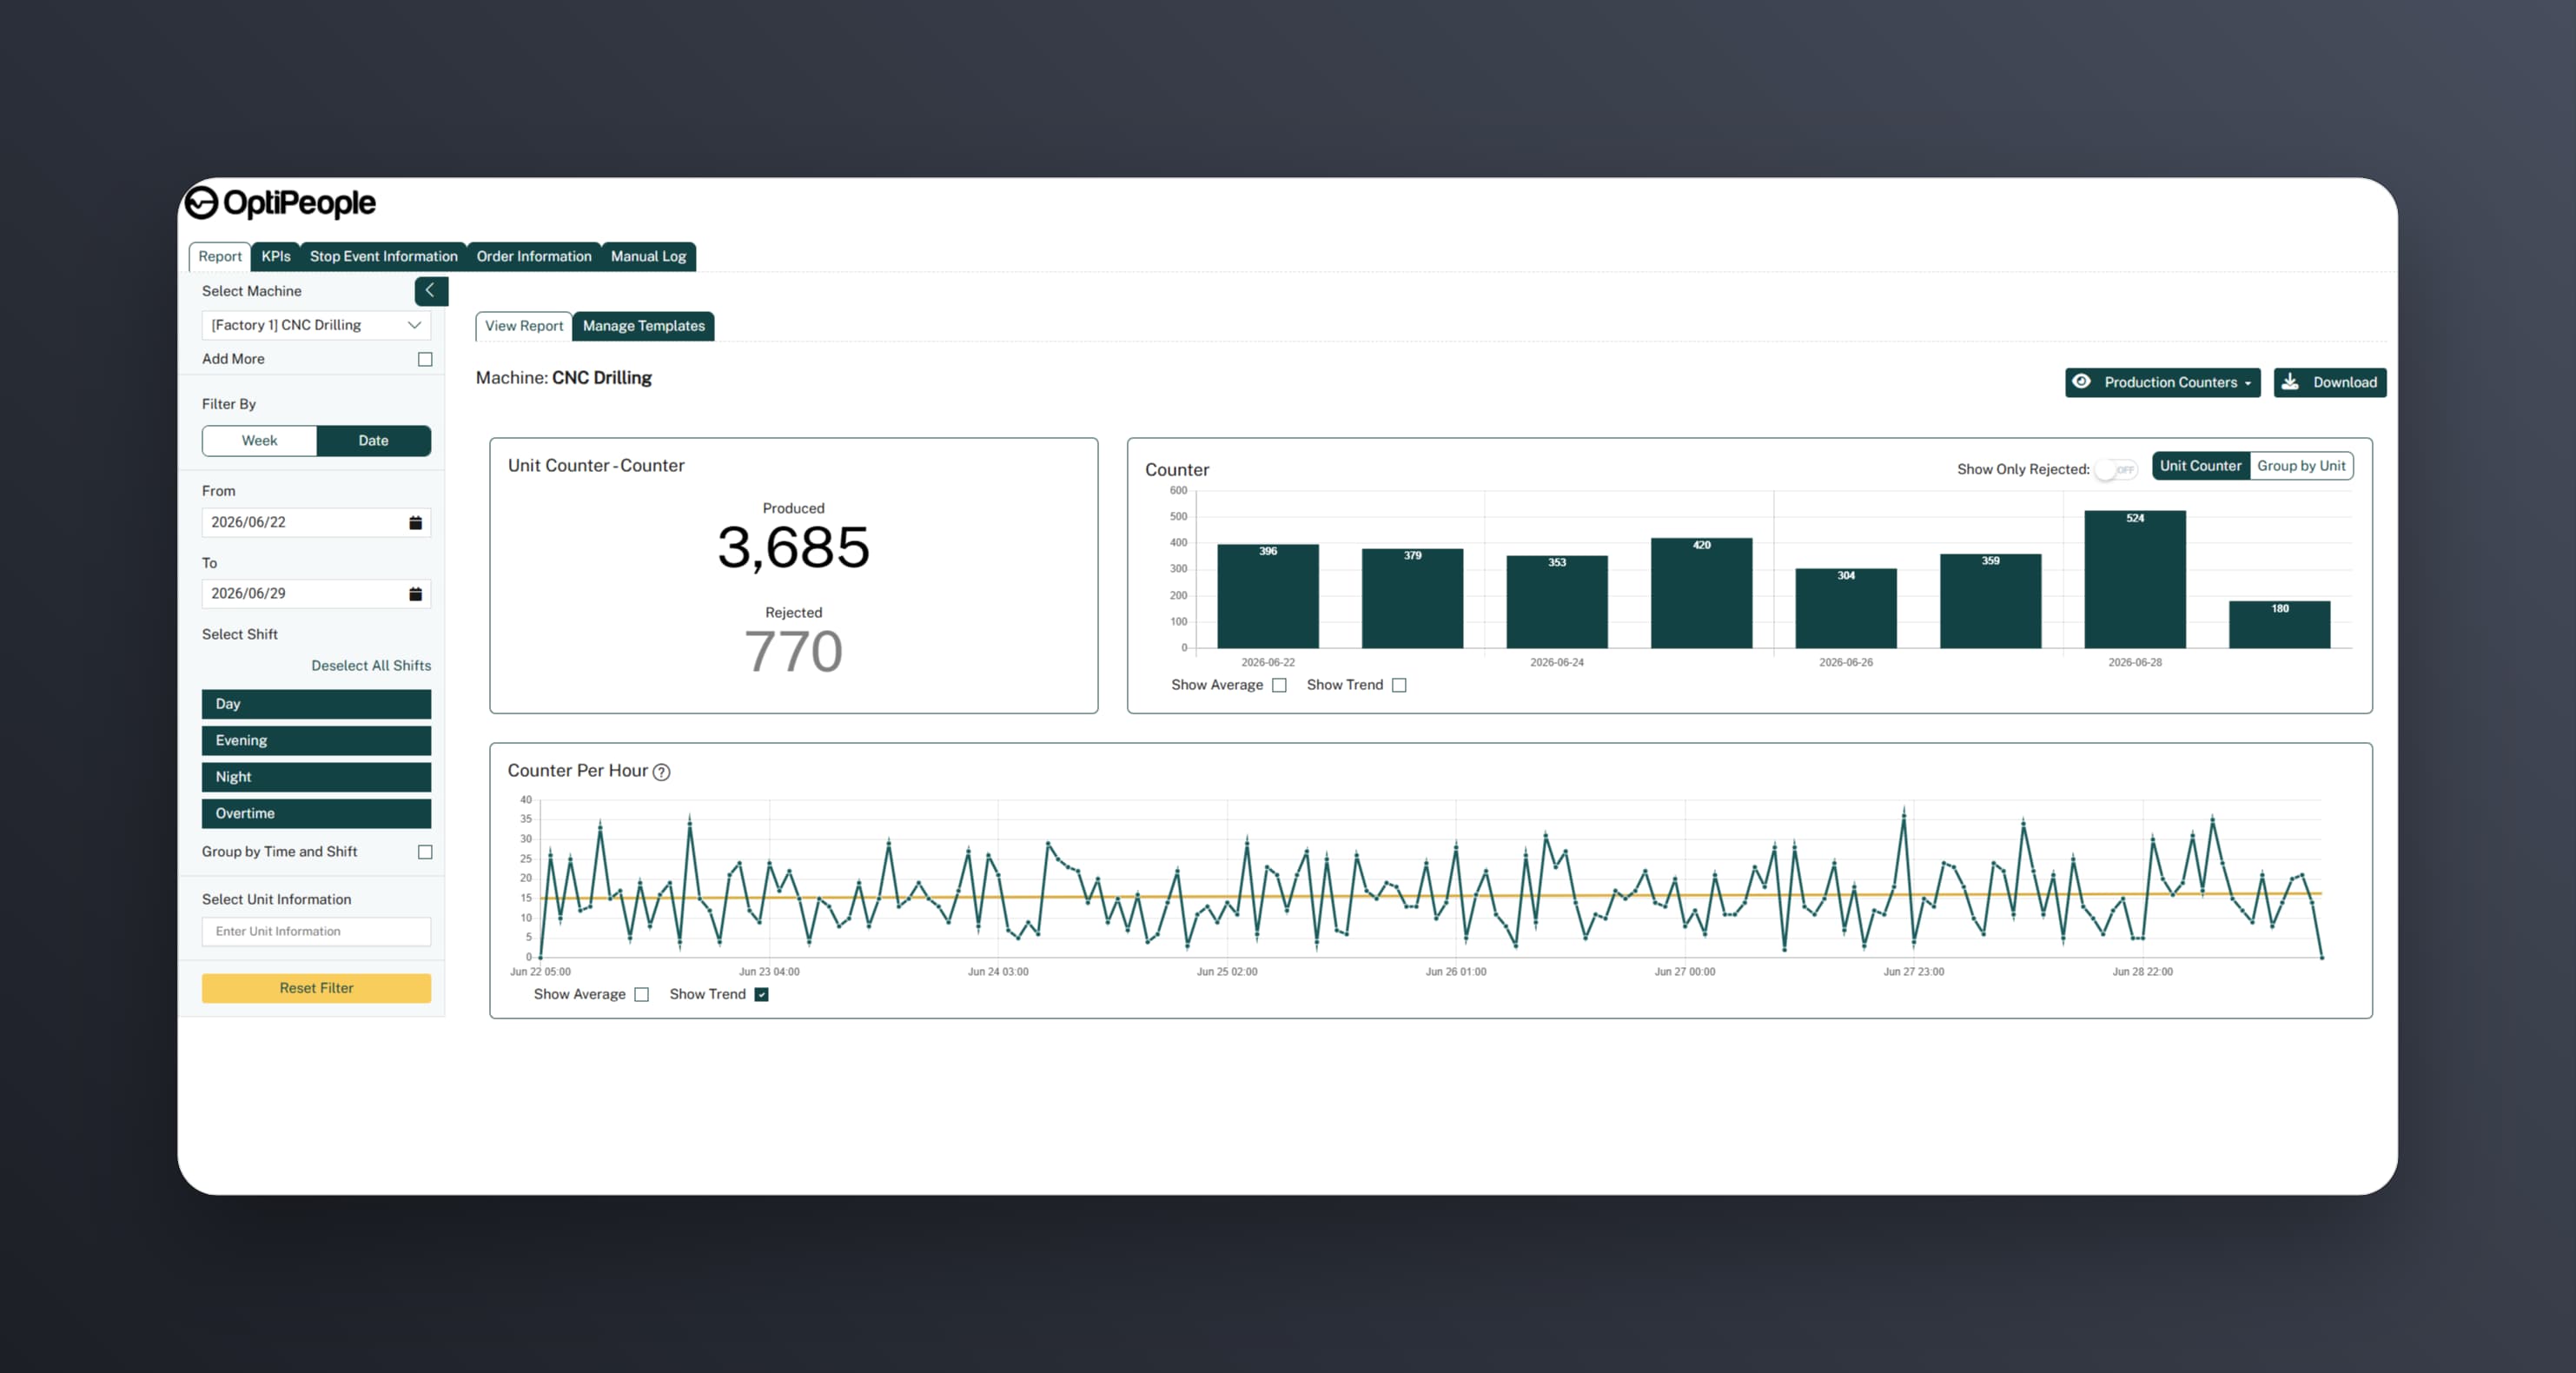
OptiPeople production counter report with produced and rejected totals and an hourly output trend

Other relevant features

Turn insight into action

We help you get your orders produced.