
Insights
How to improve OEE: 7 steps with examples
by OptiPeople Team
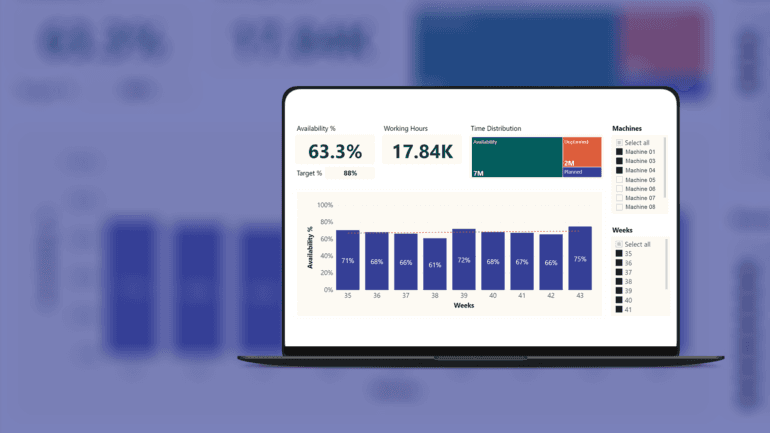
To improve OEE, first measure it automatically so the numbers are trusted. Then find which factor loses the most: availability, performance or quality. Register why every stop happens and fix the biggest causes first. Most plants gain the most from fewer unplanned stops, shorter changeovers and fewer short stops, before they ever need to touch quality.
What are the steps to improve OEE?
- Measure OEE automatically, per machine and per shift.
- Start with the bottleneck machine.
- Find the factor that loses the most.
- Register stop causes and fix the biggest ones first.
- Shorten changeovers.
- Remove short stops and slow running.
- Cut scrap and start-up rejects.
Then repeat. Each round, the biggest loss moves somewhere else.
Why should you measure OEE automatically?
Because manual OEE is too optimistic. Shift sheets miss the stops of a minute or two and the time the machine runs below full speed. Those losses are often the largest, and on paper they disappear.
Automatic measurement from the machine also makes the number current. Operators see the shift they are on, not last month's average, so they can act while the stop is still happening. If you are unsure how the number is built, see how to calculate OEE.
Which machine should you start with?
The bottleneck: the machine that limits how much the whole line or plant can make. One more hour on the bottleneck is one more hour of output. One more hour on a machine that waits for the bottleneck anyway gains nothing.
If you do not know which machine is the bottleneck, look for the one with work piling up in front of it and the machines after it waiting.
How do you find which OEE factor to improve?
Split OEE into its three factors and look at the gaps, not the percentages:
| Factor | If it is low, look at | Typical fix |
|---|---|---|
| Availability | Breakdowns, waiting for material or operators, changeovers | Stop cause registration, planned maintenance, faster changeovers |
| Performance | Short stops, jams, reduced speed | Fix recurring jams, run at the right speed, clean sensors and guides |
| Quality | Scrap, rework, start-up rejects | Stable settings after changeovers, catch drift early |
Example: a packing machine runs at 85% availability, 70% performance and 99% quality, which is an OEE of 58.9%. Quality is close to perfect, so there is little to gain there. Performance loses 30 points, double what availability loses. The place to start is the short stops and the speed, not the breakdowns everyone talks about.
How do stop causes help improve OEE?
A stop cause turns lost time into something you can act on. When operators register why the machine stopped, a Pareto chart of the week shows which few causes take most of the time. Typically three or four causes account for more than half of all stop time.
Fix the biggest cause, check that it is gone in next week's data, and move on to the next. Without stop causes, the team argues about what the problem is. With them, the data says it.
Example: a line loses 6 hours a week to stops. The stop causes show that 2.5 hours are "waiting for material". That is a planning and logistics problem, not a machine problem, and no amount of maintenance would have fixed it.
How do you shorten changeovers?
Changeovers often take the largest single share of availability. The standard method is SMED (Single-Minute Exchange of Die):
- Separate the work that has to be done with the machine stopped from the work that can be done while it runs.
- Move as much as possible to while the machine runs: fetching tools, material and the next program.
- Standardize the rest, with a checklist and the same steps every time.
Example: a changeover that takes 60 minutes, three times a day, costs 3 hours of a 24-hour plan. Cutting it to 30 minutes gives 1.5 hours back, which on its own lifts availability by more than 6 points.
How do you reduce short stops and slow running?
Short stops (jams, a sensor that trips, a part that sits wrong) last seconds or minutes, so nobody writes them down. They show up as low performance. Measuring them automatically is the only reliable way to see how often they happen and on which product.
Slow running often comes from a machine that was turned down once to avoid a problem and never turned up again. Compare the actual speed with the ideal speed per product, and ask why each gap is there.
How do you reduce scrap and rework?
Most scrap happens right after a changeover or a start-up, while the process settles. Record when scrap happens, not just how much. If it clusters after changeovers, the fix is better settings and a faster way to a stable process, not more inspection.
Count rework as bad parts in quality. The time spent making a part twice is time lost.
What role does maintenance play in OEE?
Breakdowns lower availability, and worn equipment often shows up as lower speed and more scrap. Planned maintenance moves that work out of production time and into planned stops, which do not count against OEE. Maintenance based on run hours or counts, instead of the calendar, hits the machines that actually need it. OEE for maintenance covers that side in more detail.
How much can OEE improve?
A plant that starts measuring at 40 to 50% can often gain 5 to 10 points in the first months, mainly from seeing the stops and acting on them. Dansk Træemballage raised OEE by 5% in three months on its first line. After that, gains come more slowly and from deeper work on changeovers and process stability. The long-term reference is world-class OEE at 85%.
How do you track OEE improvement?
The OptiPeople OEE module collects run time, counts and stops straight from the machines and shows availability, performance, quality and OEE live per machine, line and shift. Operators register the stop cause at the machine, and the stop cause Pareto shows what to fix next. Follow the trend per week to see whether a fix held.
FAQ
What is the fastest way to improve OEE?
Start registering stop causes on the bottleneck machine and fix the biggest cause. It needs no investment, and the first causes are often simple: waiting for material, a recurring jam, a slow changeover.
Which OEE factor is easiest to improve?
Usually availability, because stops are visible and the causes can be registered. Performance often has the largest hidden loss, but it needs automatic data to see it.
How long does it take to improve OEE?
Plants that start measuring often see the first gains within weeks, because the biggest stop causes are easy to fix once they are visible. A lift of 5 to 10 points within a few months is common.
Does lean help improve OEE?
Yes. OEE is a lean and TPM tool: it measures the waste that lean tries to remove. Methods like SMED, 5S and root cause analysis are the usual ways to act on what OEE shows.
What is a realistic OEE target?
Set the target from where you are now, not from world class. If a machine runs at 55%, aim for 60 to 65% first, then raise the target once it holds.